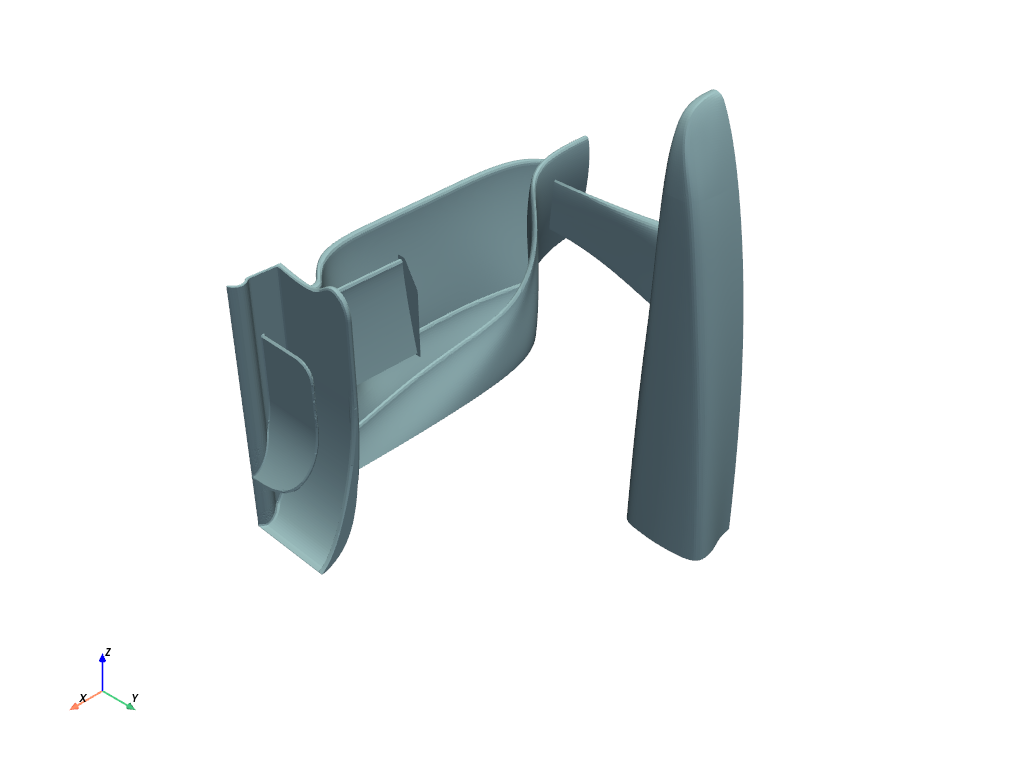
Visualize model#
This guide uses a model of a race car’s front wing.
>>> import tempfile
>>> import pathlib
>>> import ansys.acp.core as pyacp
>>> from ansys.acp.core.extras import ExampleKeys, get_example_file
>>> acp = pyacp.launch_acp()
>>> tempdir = tempfile.TemporaryDirectory()
>>> input_file = get_example_file(
...     ExampleKeys.RACE_CAR_NOSE_ACPH5, pathlib.Path(tempdir.name)
... )
>>> model = acp.import_model(input_file)
>>> input_file_geometry = get_example_file(
...     ExampleKeys.RACE_CAR_NOSE_STEP, pathlib.Path(tempdir.name)
... )
>>> cad_geometry = model.create_cad_geometry(name="nose_geometry")
>>> cad_geometry.refresh(input_file_geometry)
>>> model.update()
Show the mesh#
Access the mesh data using the Model.mesh attribute. This attribute, an instance of the MeshData class, can be converted to a PyVista mesh using the MeshData.to_pyvista() method.
>>> model.mesh.to_pyvista().plot()
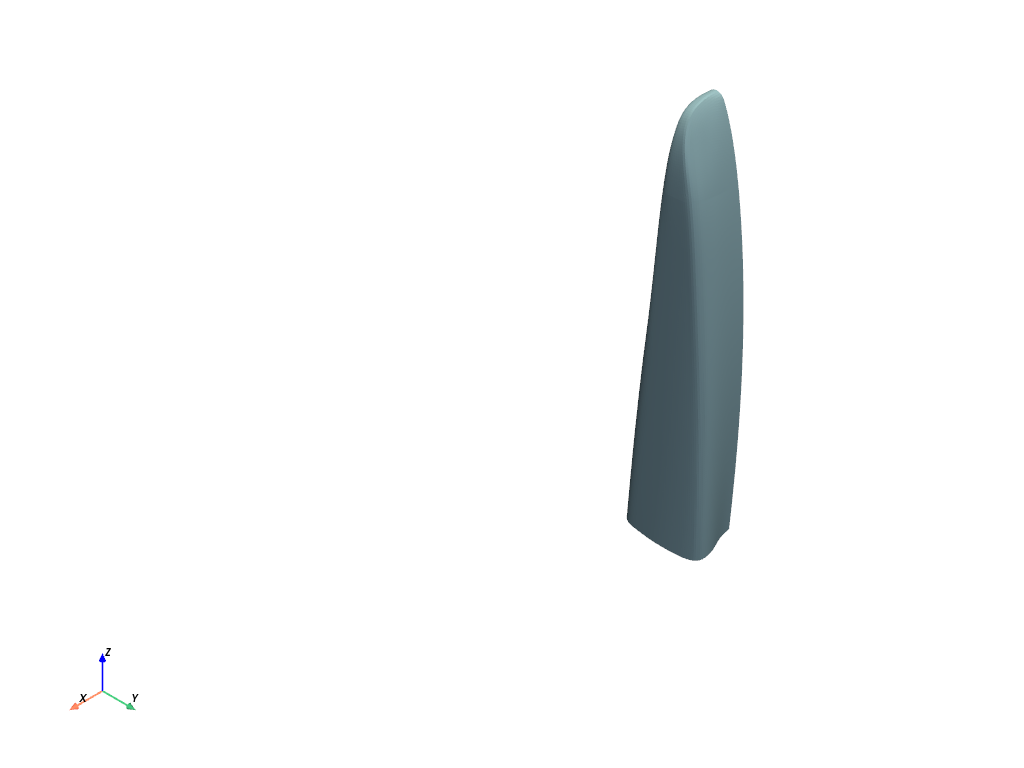
You can also access and plot the mesh data for specific tree objects. For example, the following code plots the mesh for a modeling ply.
>>> modeling_ply = model.modeling_groups['nose'].modeling_plies['mp.nose.4']
>>> modeling_ply.mesh.to_pyvista().plot()
Showing the directions#
Show the directions (such as normals, fiber directions, and orientations) of the model by using the get_directions_plotter() helper function. This function takes the model, the components to visualize, and some optional parameters.
The following example shows the orientation and fiber direction of a modeling ply.
>>> elemental_data = modeling_ply.elemental_data
>>> directions_plotter = pyacp.get_directions_plotter(
...     model=model,
...     components=[
...         elemental_data.orientation,
...         elemental_data.fiber_direction
...     ],
...     length_factor=10.,
...     culling_factor=10,
... )
>>> directions_plotter.show()
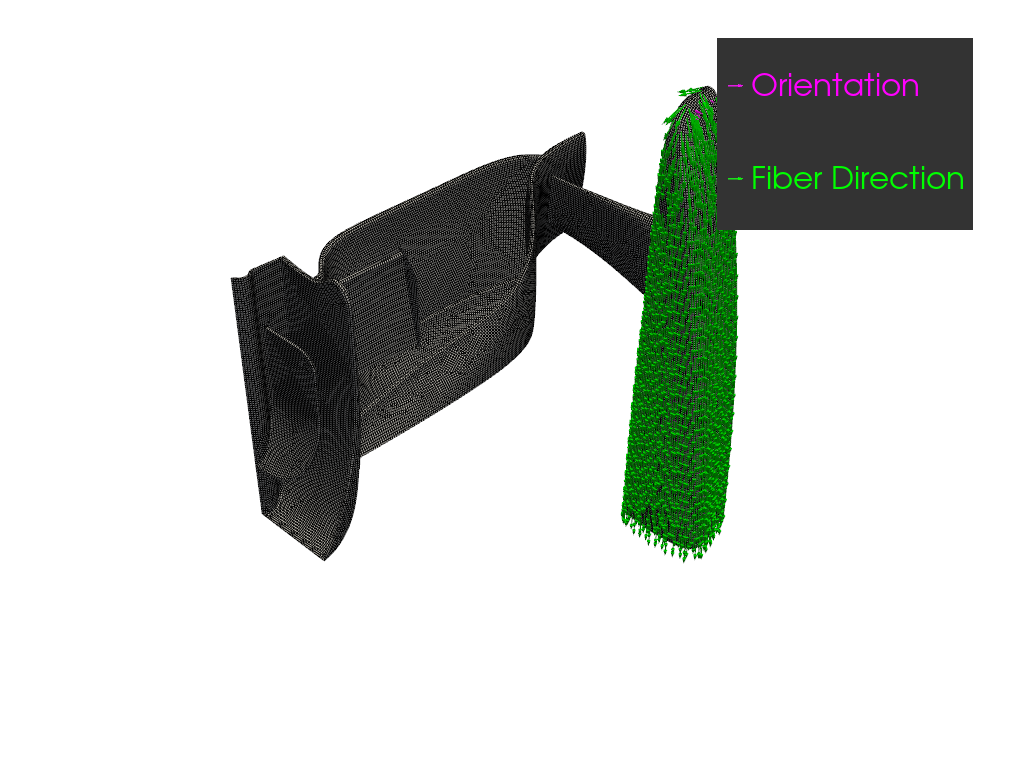
The color scheme used in this plot for the various components matches the ACP GUI.
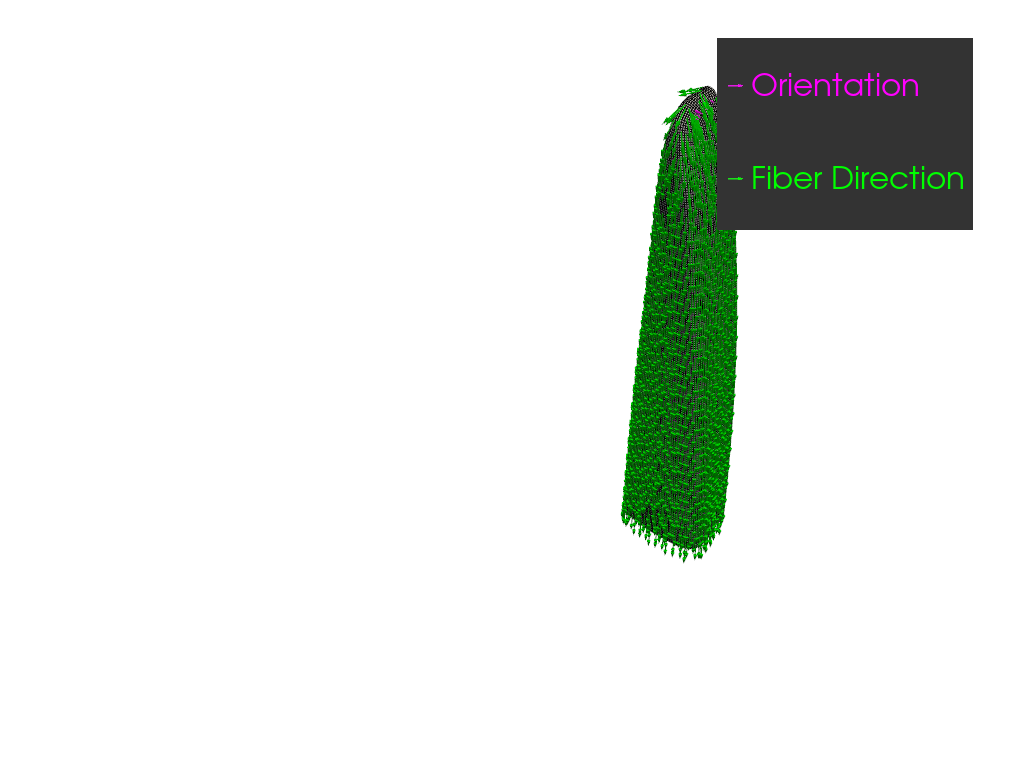
The directions plot can be scoped to a specific region of the model by using the mesh parameter. For example, the following code only plots the part covered by the modeling ply.
>>> directions_plotter = pyacp.get_directions_plotter(
...     model=model,
...     mesh=modeling_ply.mesh,
...     components=[
...         elemental_data.orientation,
...         elemental_data.fiber_direction
...     ],
...     length_factor=10.,
...     culling_factor=10,
... )
>>> directions_plotter.show()
Showing the mesh data#
Access the mesh data related to a specific ACP object using the elemental_data and nodal_data attributes. These attributes represent either scalar or vector data.
Scalar data#
You can convert scalar data to a PyVista mesh using the get_pyvista_mesh method. This method requires the base model mesh.
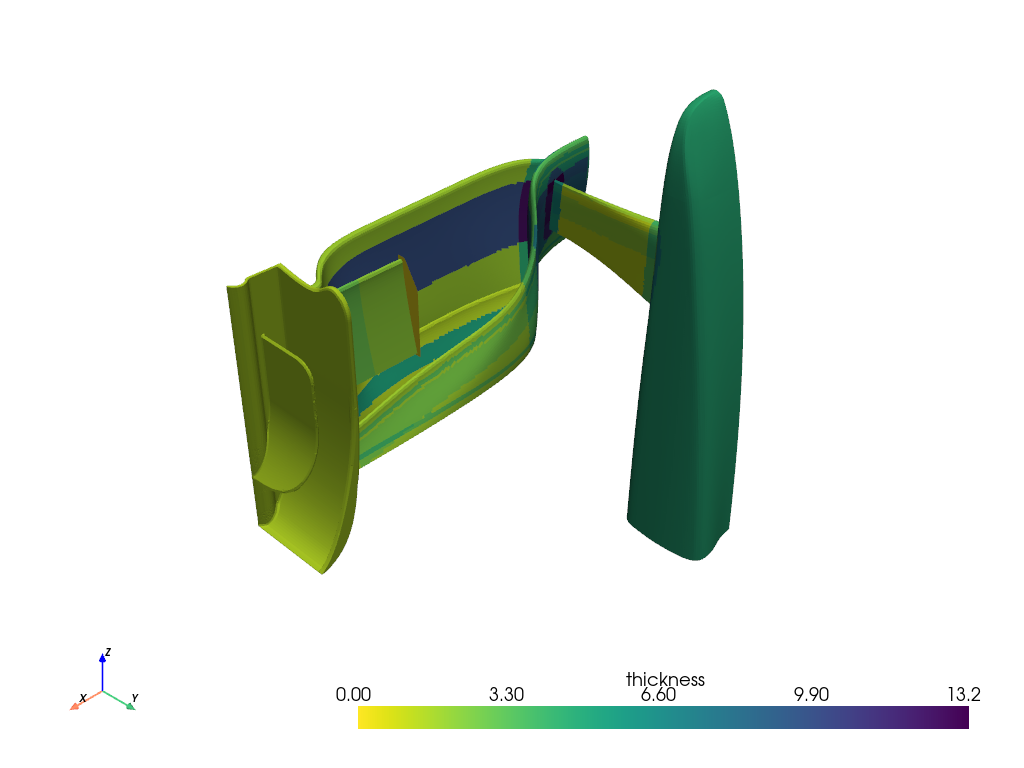
For example, you can plot the total thickness of the model using this code:
>>> thickness_data = model.elemental_data.thickness
>>> pyvista_mesh = thickness_data.get_pyvista_mesh(mesh=model.mesh)
>>> pyvista_mesh.plot()
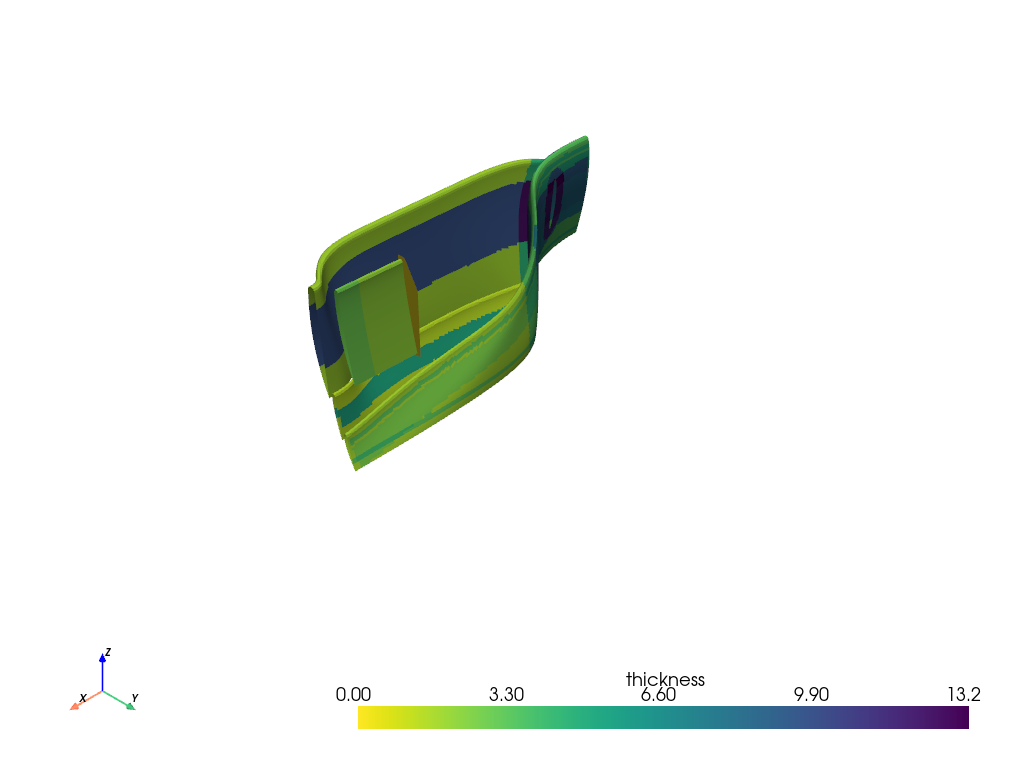
Again, the mesh parameter can be used to limit the scope of the plot.
>>> pyvista_mesh = thickness_data.get_pyvista_mesh(mesh=model.element_sets["els_wing_assembly"].mesh)
>>> pyvista_mesh.plot()
Vector data#
Visualize vector data using the get_directions_plotter() function shown in the preceding section Showing the directions. If you need more fine-grained control over the visualization, you can use the method shown in this section instead.
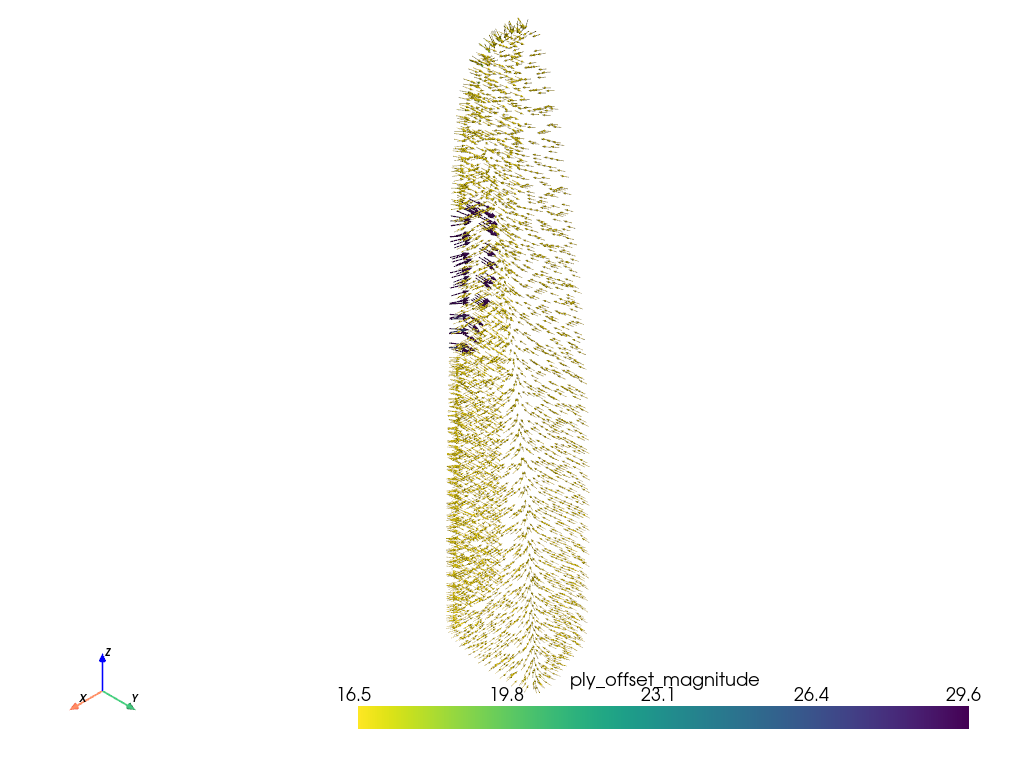
Vector data can be converted to PyVista glyphs using the get_pyvista_glyphs method. This method requires the base model mesh.
You can also choose a scaling factor to change the size of the vector glyphs and a culling factor to reduce the number of glyphs plotted.
>>> production_ply = model.modeling_groups['nose'].modeling_plies['mp.nose.6'].production_plies['ProductionPly.20']
>>> ply_offset = production_ply.nodal_data.ply_offset
>>> ply_offset.get_pyvista_glyphs(mesh=model.mesh, scaling_factor=6., culling_factor=5).plot()
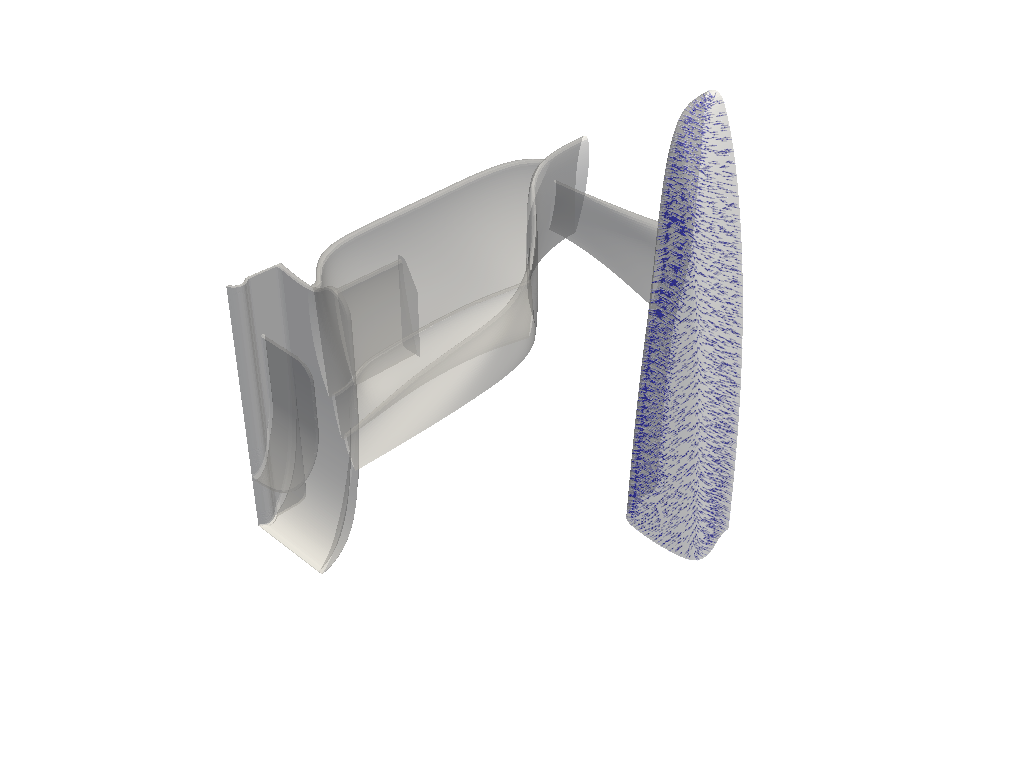
The base mesh is not shown when plotting vector data using PyVista glyphs. To visualize the mesh, you can combine the mesh and glyphs together using a PyVista plotter.
>>> import pyvista
>>> plotter = pyvista.Plotter()
>>> _ = plotter.add_mesh(model.mesh.to_pyvista(), color="white", opacity=0.5)
>>> _ = plotter.add_mesh(
...     ply_offset.get_pyvista_glyphs(mesh=model.mesh, scaling_factor=6., culling_factor=5),
...     color="blue"
... )
>>> plotter.show()
Showing geometries#
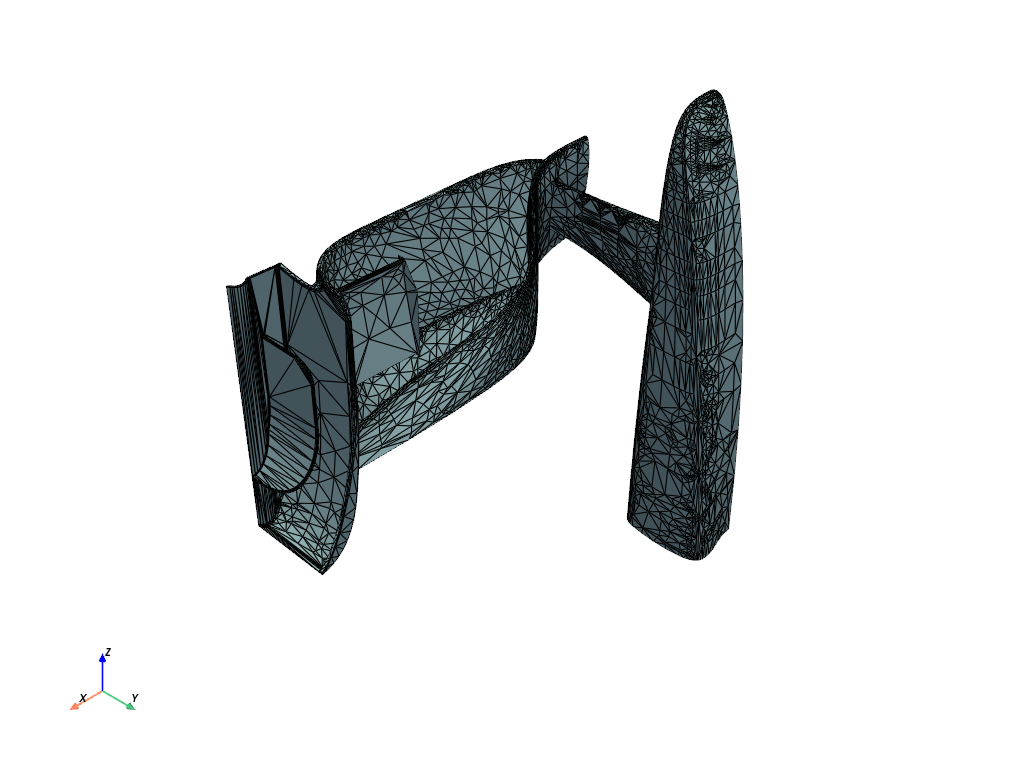
You can view CAD geometries using their visualization_mesh attribute. This attribute contains a tessellated (triangular) mesh that represents the geometry.
For plotting, the tessellated mesh has a .to_pyvista method that returns a PyVista PolyData object. To see its triangular nature, plot the mesh with the show_edges option set to True.
>>> cad_geometry = model.cad_geometries['nose_geometry']
>>> tessellated_mesh = cad_geometry.visualization_mesh
>>> tessellated_mesh.to_pyvista().plot(show_edges=True)
Showing solid model#
The visualization of a solid mesh and its elemental data is shown in the example Solid Model.